
Capstone Metals — gold and silver IRA dealer
Speak with a specialist: (800) 200-9553Monday – Friday, 7am – 4pm Pacific

Money & Currency

Understanding the impacts of dollar devaluation

Dollar devaluation means each dollar buys less than it did — at the store, at the pump, and in a retirement account that has to fund decades of spending. This page explains what devaluation is, where you are exposed, what the reserve-currency data actually shows, and the steps a household or business can take next. Facts are cited; interpretation is labeled as interpretation.

Monday – Friday, 7am – 4pm Pacific

  • Licensed and insured since 2014
  • Fiduciary advisory — licensed since 1970
  • Preferred Trust & GoldStar custodians
  • No card payments, no pressure, no commissions-first pitch

What changes

Purchasing power, not the number

Dollar reserve share

~57% of allocated reserves (IMF, Q1 2026)

Central-bank gold

~1,000 t/yr recent average (WGC)

What to do first

Measure exposure, then size it

What dollar devaluation actually means

Two different things get called devaluation. The first is domestic: inflation, where the same basket of goods costs more dollars over time. The second is external: the dollar's exchange rate against other currencies, which changes the cost of imports, travel and foreign-currency obligations. Both reduce what a dollar commands, but they show up in different parts of your life, and they do not always move together. A dollar can weaken abroad while domestic inflation cools, and vice versa.

  • Domestic devaluation: prices rise, wages and fixed income lag
  • External devaluation: imports, travel and foreign invoices cost more
  • Savings held in cash lose real value quietly, without a statement showing a loss
  • Debt fixed in dollars becomes easier to repay in devalued dollars

Descending step chart showing what one dollar bought across successive decades
The slow loss most households feel before they can name it.
Describe this illustration: Descending step chart showing what one dollar bought across successive decades

The slow loss most households feel before they can name it. This original Capstone Metals chart illustrates descending step chart showing what one dollar bought across successive decades. It is educational artwork, not a price forecast, performance record or recommendation.

Where you are exposed — a one-time checklist

Exposure is specific, not general. Work through this list once and write down amounts rather than impressions. Most people discover their real exposure sits in two or three places, not everywhere.

  • Cash and cash-equivalents held for more than 12 months
  • Fixed income: pensions, annuities, bonds, long-dated CDs
  • Imported goods, components or inventory you buy regularly
  • Foreign revenue, supplier contracts or overseas purchases
  • Retirement assets that must fund 20–30 years of spending
  • Planned large expenses more than three years out
Illustration of the same shopping basket priced in three different decades
Purchasing power in the only terms that matter — what the money buys.
Describe this illustration: Illustration of the same shopping basket priced in three different decades

Purchasing power in the only terms that matter — what the money buys. This original Capstone Metals illustration illustrates illustration of the same shopping basket priced in three different decades. It is educational artwork, not a price forecast, performance record or recommendation.
De-dollarization timeline: what has actually happened

The reserve system has changed in steps, not in a single collapse. Each entry below is a documented event; none of them, individually or together, has ended the dollar's reserve role. FACT-level history, dates as recorded.

  • 1944 — Bretton Woods fixes major currencies to the dollar, dollar to gold at $35/oz
  • 1971 — The United States suspends dollar convertibility into gold; the fixed system ends
  • 1974 — Dollar invoicing of oil is entrenched; deep Treasury markets absorb surpluses
  • 1999 — The euro launches and becomes the clear second reserve currency (~20% of major international-use measures, ECB, June 2026)
  • 2009 — China begins settling trade in renminbi; cross-border payment pilots follow
  • 2015 — CIPS launches as a renminbi clearing system alongside, not instead of, existing rails
  • 2022 — Reserve-asset freezes prompt several central banks to accelerate gold buying
  • 2022–2026 — Central banks buy roughly 1,000 tonnes of gold a year, about double the prior decade's pace (World Gold Council)
  • 2024–2026 — BRICS expands and discusses payment integration; no common currency has been issued
  • Q1 2026 — The dollar's share of allocated FX reserves is 57.13%, up from 56.42% in Q4 2025, on total reserves of $13.10T (IMF COFER)
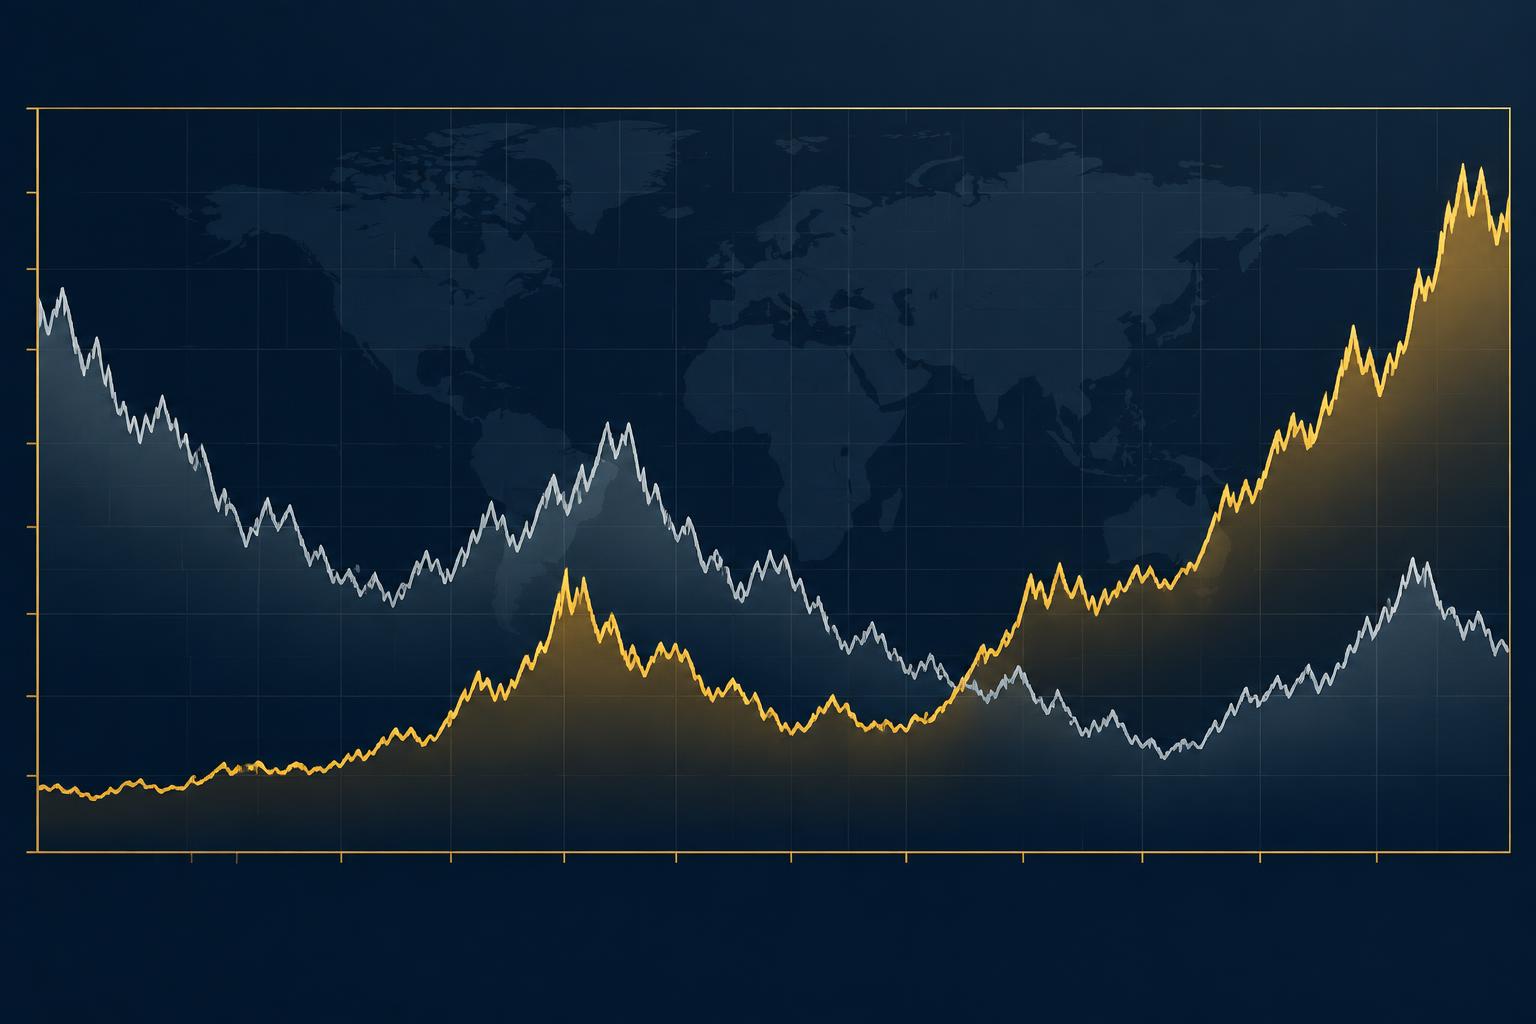
Chart pairing a trade-weighted dollar index with the gold price over several decades
Gold is priced in dollars, so the dollar is half of every gold chart.
Describe this illustration: Chart pairing a trade-weighted dollar index with the gold price over several decades

Gold is priced in dollars, so the dollar is half of every gold chart. This original Capstone Metals chart illustrates chart pairing a trade-weighted dollar index with the gold price over several decades. It is educational artwork, not a price forecast, performance record or recommendation.
BRICS vs G7: what the data shows, measure by measure

Headlines treat this as one scoreboard. It is not — the answer changes with the measure, and mixing the measures is how misleading claims get made. Read each line as a separate comparison rather than a verdict.

  • Output at purchasing-power parity: the BRICS bloc is larger than the G7 (IMF WEO). This measures domestic purchasing power, not international financial capacity
  • Output at market exchange rates: the G7 remains substantially larger — the measure that governs cross-border capital
  • Population and industrial base: BRICS is far larger, with dominant shares of several critical minerals and rare-earth processing (USGS)
  • Energy: BRICS members include major producers and major importers, so the bloc is not aligned on price
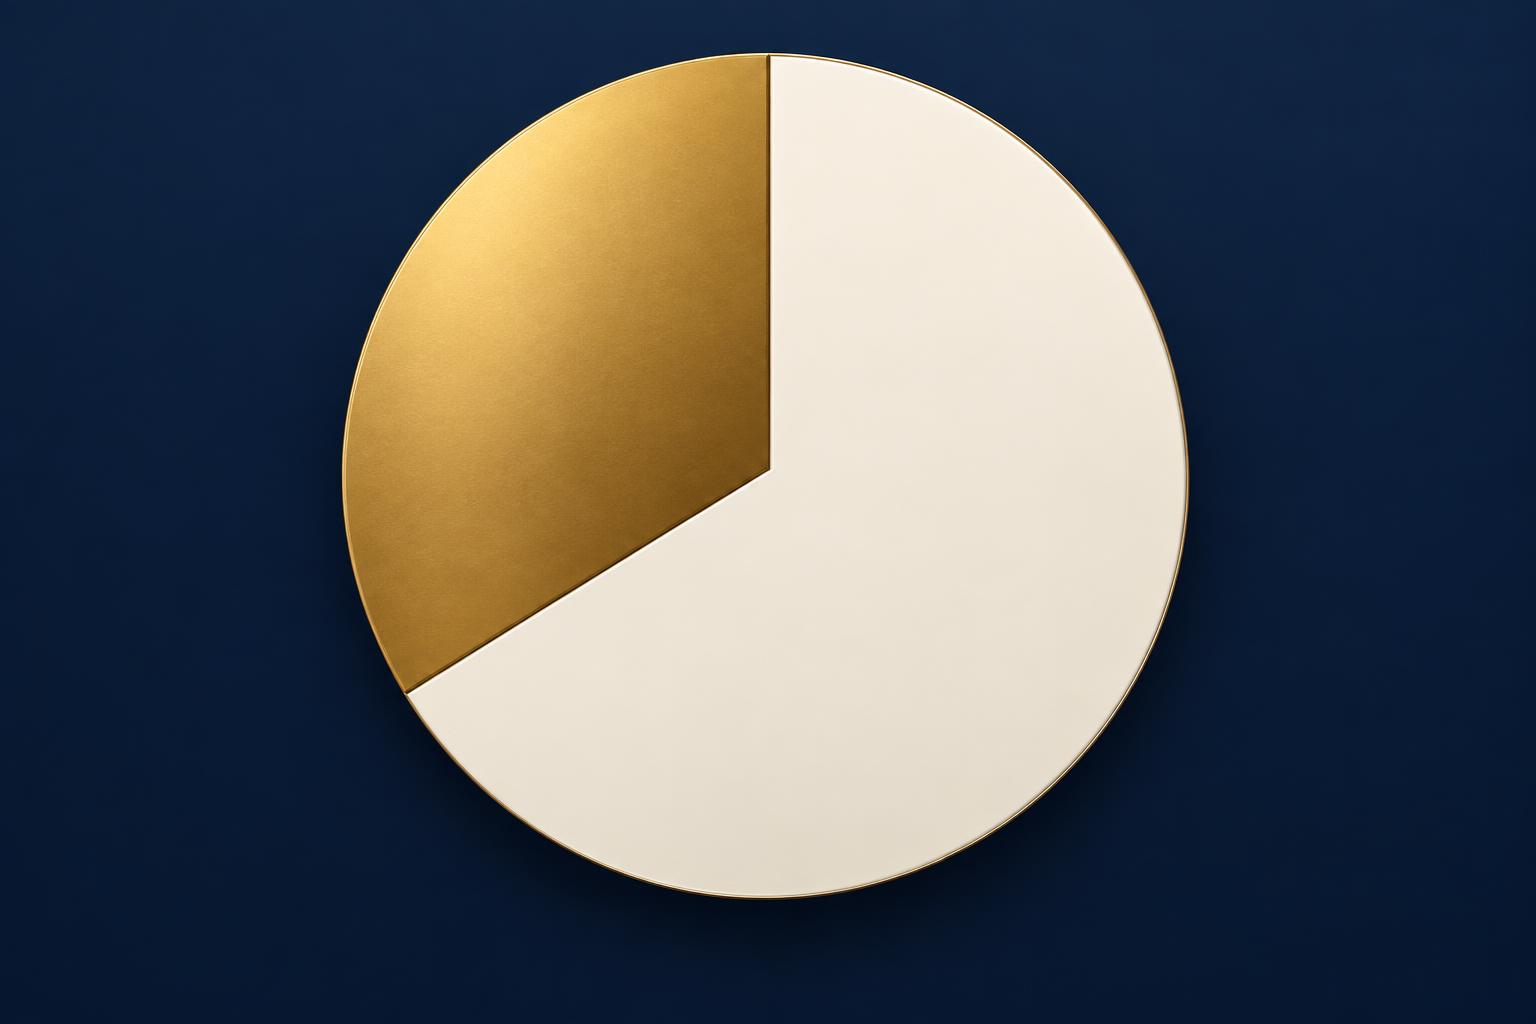
  • Reserve assets: the dollar is ~57% of allocated reserves; no BRICS currency approaches double digits (IMF COFER)
  • Foreign exchange turnover: the dollar sits on one side of about 89% of all trades (BIS 2025 survey) — note each trade has two currencies, so shares sum to 200%
  • Capital-market depth: Treasury markets have no rival for size and liquidity, which is the practical bar for a reserve currency
  • Payment infrastructure: alternative rails exist and are growing, but remain small relative to correspondent-bank dollar clearing
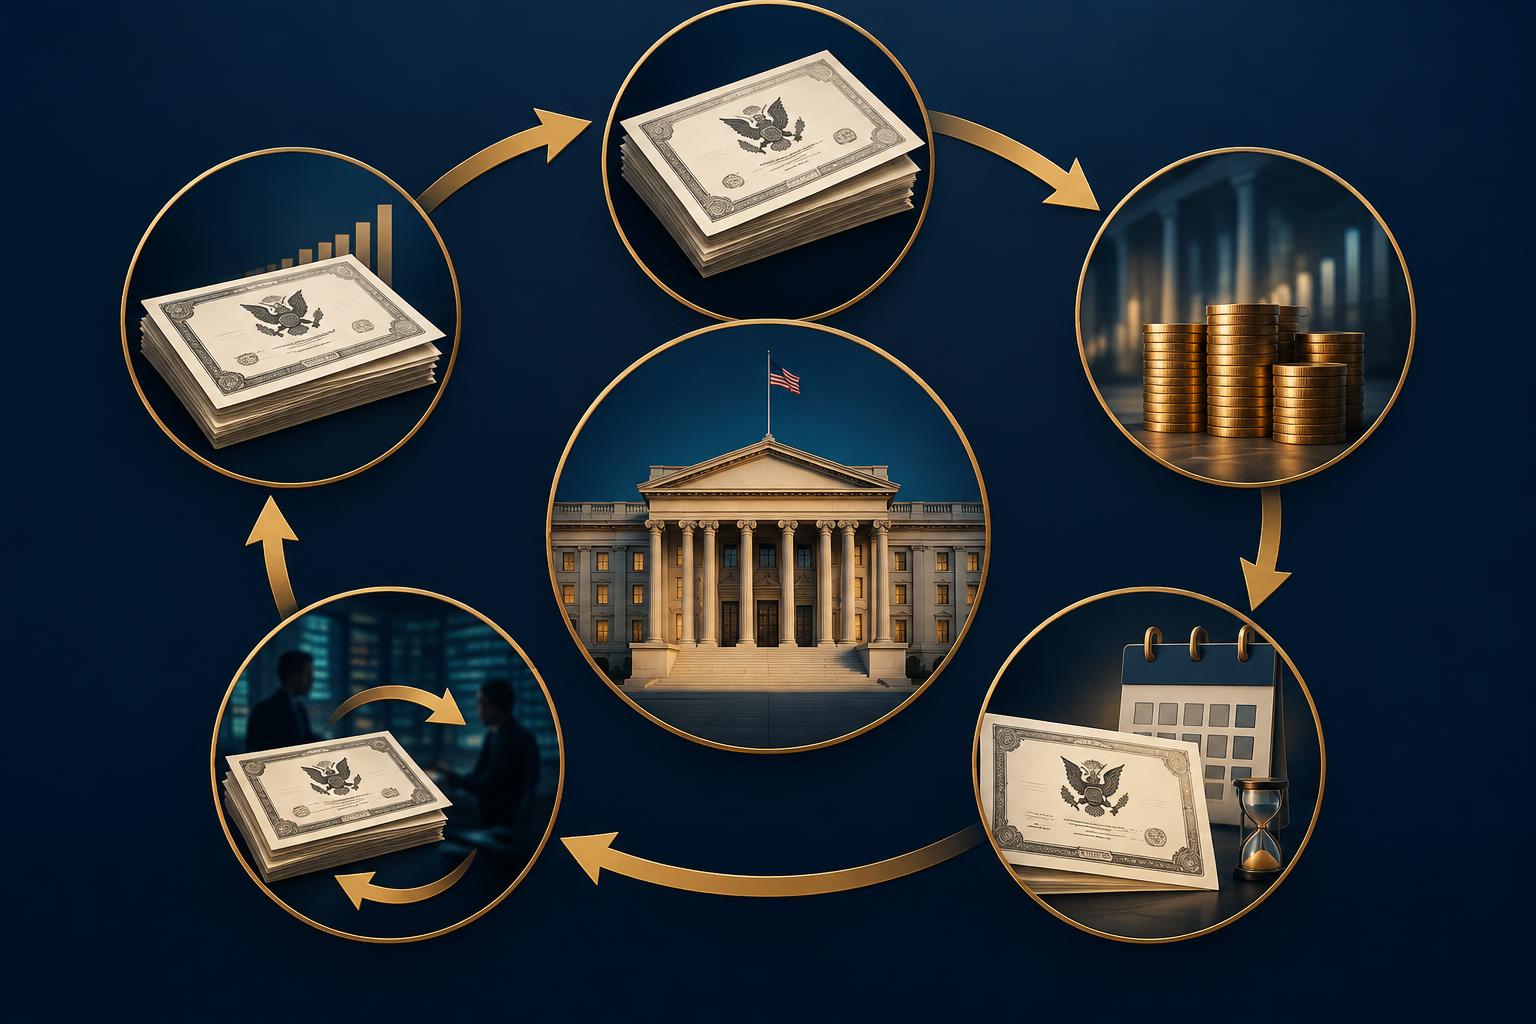
Circular diagram showing debt issued, redeemed and reissued, with buybacks shown as replacement issuance rather than retirement
Buybacks retire selected securities and are normally accompanied by replacement issuance. The distinction is routinely misreported.
Describe this illustration: Circular diagram showing debt issued, redeemed and reissued, with buybacks shown as replacement issuance rather than retirement

Buybacks retire selected securities and are normally accompanied by replacement issuance. The distinction is routinely misreported. This original Capstone Metals diagram illustrates circular diagram showing debt issued, redeemed and reissued, with buybacks shown as replacement issuance rather than retirement. It is educational artwork, not a price forecast, performance record or recommendation.

Separating the claims: fact, inference and hypothesis

FACT: reserve managers are diversifying, gold buying has roughly doubled versus the prior decade, and alternative payment systems are being built. INFERENCE: those choices reflect concern about concentration and sanctions risk as much as about the dollar's economics. HYPOTHESIS: a slow, partial shift toward a multi-currency-plus-gold system continues. NOT SUPPORTED: that the dollar has lost, or is about to lose, reserve-currency status. Russia's own spokesman said in September 2026 that it is not pursuing de-dollarization and is open to workable payment methods — settlement diversification is not the same claim as abolishing the dollar.

Proportional chart of Treasury debt holders separating domestic holders from foreign official and private holders
Foreign holders own a substantial minority, not the majority the popular claim asserts.
Describe this illustration: Proportional chart of Treasury debt holders separating domestic holders from foreign official and private holders

Foreign holders own a substantial minority, not the majority the popular claim asserts. This original Capstone Metals chart illustrates proportional chart of treasury debt holders separating domestic holders from foreign official and private holders. It is educational artwork, not a price forecast, performance record or recommendation.

What would actually have to change

A reserve currency needs four things at once: deep and liquid government debt markets, open capital accounts, credible rule of law, and willingness to run the external position that supplies the world with the asset. No current challenger has all four. That is why the more defensible expectation is gradual fragmentation — more currencies used in trade, more gold on central-bank balance sheets — rather than a single replacement event.

  • Deep, liquid, freely tradable government bond market
  • Open capital account and convertibility under stress
  • Legal predictability for foreign holders
  • Acceptance of the trade and capital-flow consequences
Diagram of cross-border payment routes with an alternative settlement path drawn alongside the dominant one
Payment rails, not slogans, are where de-dollarisation would actually show up.
Describe this illustration: Diagram of cross-border payment routes with an alternative settlement path drawn alongside the dominant one

Payment rails, not slogans, are where de-dollarisation would actually show up. This original Capstone Metals diagram illustrates diagram of cross-border payment routes with an alternative settlement path drawn alongside the dominant one. It is educational artwork, not a price forecast, performance record or recommendation.
A practical response, in order

Devaluation is a slow risk, and slow risks reward preparation over reaction. Work in this sequence: measure, then decide how much of the exposure you actually want to carry, then choose instruments — in that order. Precious metals are one tool for the purchasing-power portion of the problem; they pay no income, and no one can promise a price. Size any allocation so a bad year does not force a sale.

  • Measure: total the exposures from the checklist above in dollars
  • Decide: what share of long-horizon savings should sit outside dollar-denominated paper
  • Choose: cash-flow timing, currency hedging where relevant, and a physical metals allocation commonly held at 5%–20%
  • Review annually rather than reacting to headlines
Horizontal timeline from the 1764 Currency Act through the gold standard's end to today's national debt total
Each marker traces to the actual statute or record, not to a summary of a summary.
Describe this illustration: Horizontal timeline from the 1764 Currency Act through the gold standard's end to today's national debt total

Each marker traces to the actual statute or record, not to a summary of a summary. This original Capstone Metals chart illustrates horizontal timeline from the 1764 currency act through the gold standard's end to today's national debt total. It is educational artwork, not a price forecast, performance record or recommendation.

Visual research library

More visual explanations

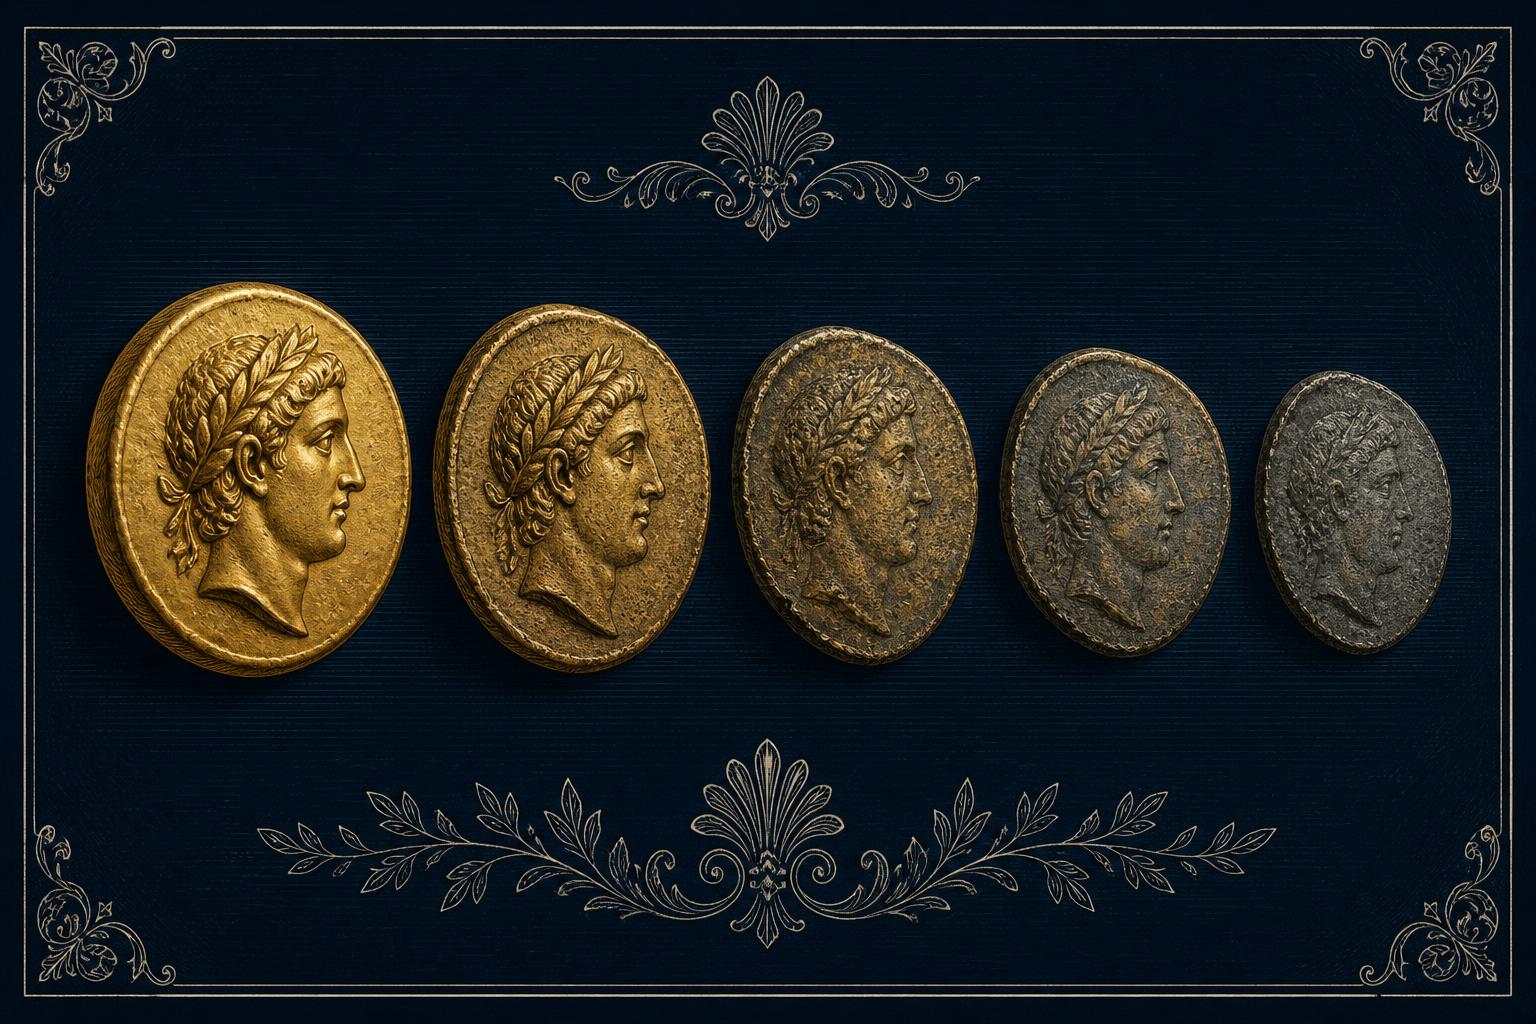
Comparative illustration of coinage from successive empires showing declining metal content over time
Debasement is old, repeated and documented. It is also not a prediction about any particular year.
Describe this illustration: Comparative illustration of coinage from successive empires showing declining metal content over time

Debasement is old, repeated and documented. It is also not a prediction about any particular year. This original Capstone Metals illustration illustrates comparative illustration of coinage from successive empires showing declining metal content over time. It is educational artwork, not a price forecast, performance record or recommendation.

Rather just ask someone?

A specialist can answer this in two minutes. Monday – Friday, 7am – 4pm Pacific.

Would a short, no-pressure conversation help?

Leave your name and number. A Capstone specialist will answer your questions during business hours.

Most gold and silver firms can only talk to you about gold and silver. We have licensed advisors on staff, so the same conversation can cover your retirement accounts, your market holdings, insurance and estate structure alongside a completely private metals purchase — one fiduciary review of everything you own, not a sales call about one product.

What would you like help understanding? (optional)

By submitting your name and phone number you are asking us to follow up, and you agree that Capstone Metals may contact you by phone, text, or email to clarify what you are looking for and make sure you receive it. Message and data rates may apply. You can ask us to stop at any time by replying STOP or telling us on the phone, and we never sell or share your information. This is a request for information and a conversation — not a purchase, an application, or advice. SMS Opt-In Policy · Privacy Policy · Terms & Conditions · How pricing works · Disclosures · Due diligence & financial risks

Licensed and insuredFiduciary advisory since 1970Independent IRA custodiansPrices quoted, never card-charged

Common questions

Is the dollar collapsing?
No evidence supports a collapse. The dollar's share of allocated global reserves was 57.13% in Q1 2026, slightly higher than the prior quarter. De-dollarization — gradual diversification of settlement and reserves — is real and measurable; a collapse is a different and unsupported claim.
Read the full BRICS vs G7 research file
What is the difference between de-dollarization and dollar collapse?
De-dollarization is a shift in how much trade and reserves use dollars, happening over decades. A collapse would mean a sudden loss of confidence in dollar-denominated assets. The first is documented; the second is a scenario, not a forecast.
Does BRICS have a common currency?
No. Members have discussed cross-border payment integration and, in 2026, central-bank digital currency links. No common BRICS currency has been issued, and significant political and technical obstacles remain.
Why are central banks buying so much gold?
Gold carries no counterparty and cannot be frozen the way reserve deposits can. The World Gold Council reports central banks have bought roughly 1,000 tonnes a year in recent years, about double the prior decade's pace, with 89% of surveyed reserve managers expecting global official holdings to rise further.
Gold's long-run price record
How does dollar devaluation affect my retirement income?
Fixed payments — pensions, annuities, long-dated bonds — buy less each year that prices rise. The number on the statement does not change, so the loss is easy to miss until it compounds.
How much to allocate
Do precious metals protect against devaluation?
Historically gold has preserved purchasing power over long periods, but it pays no income and its price can fall for years. It is one tool for part of the problem, sized as a portion of savings rather than a bet.

Get a plain dollar-risk review — no pressure

Tell us your name and phone number and we will walk your exposures with you, or download the Wealth Protection Guide first and call when you are ready. Call or text (800) 200-9553, Monday to Friday, 7am–4pm Pacific.

Licensed and insuredFiduciary advisory since 1970Independent IRA custodiansPrices quoted, never card-charged
Call (800) 200-9553 Text Email