
The State of Physical Metals
An automated sweep crawls eBay sold listings, auction-house archives and dealer asking prices up to four times a day for every product we track, and records a documented low/high retail value band with a timestamp. Our own asking prices are set by staff and are not the same as this band — this page shows the underlying evidence, not our price list.
Data last refreshed:
Reading the feed…
- Gold
- —
- Silver
- —
- Platinum
- —
How the value bands are built
4x-daily crawl
A scheduled sweep pulls the stalest products and searches marketplaces and auction archives for real sold and asked results.
Documented band
Comparable sales are synthesized into a low/high value range and stamped with the exact date and time it was recorded.
Staff-set asking price
The band is evidence, not our price. Capstone Metals staff set the actual asking price for each listing in our live inventory.
Spot price history
Every value band below is compared against melt value, which is calculated from this live spot feed. See the full live spot prices and charts page for gold, silver and platinum.
Documented retail value bands vs. melt
The gold bar shows the documented low–high retail band; the dark tick marks today's melt value from live spot.
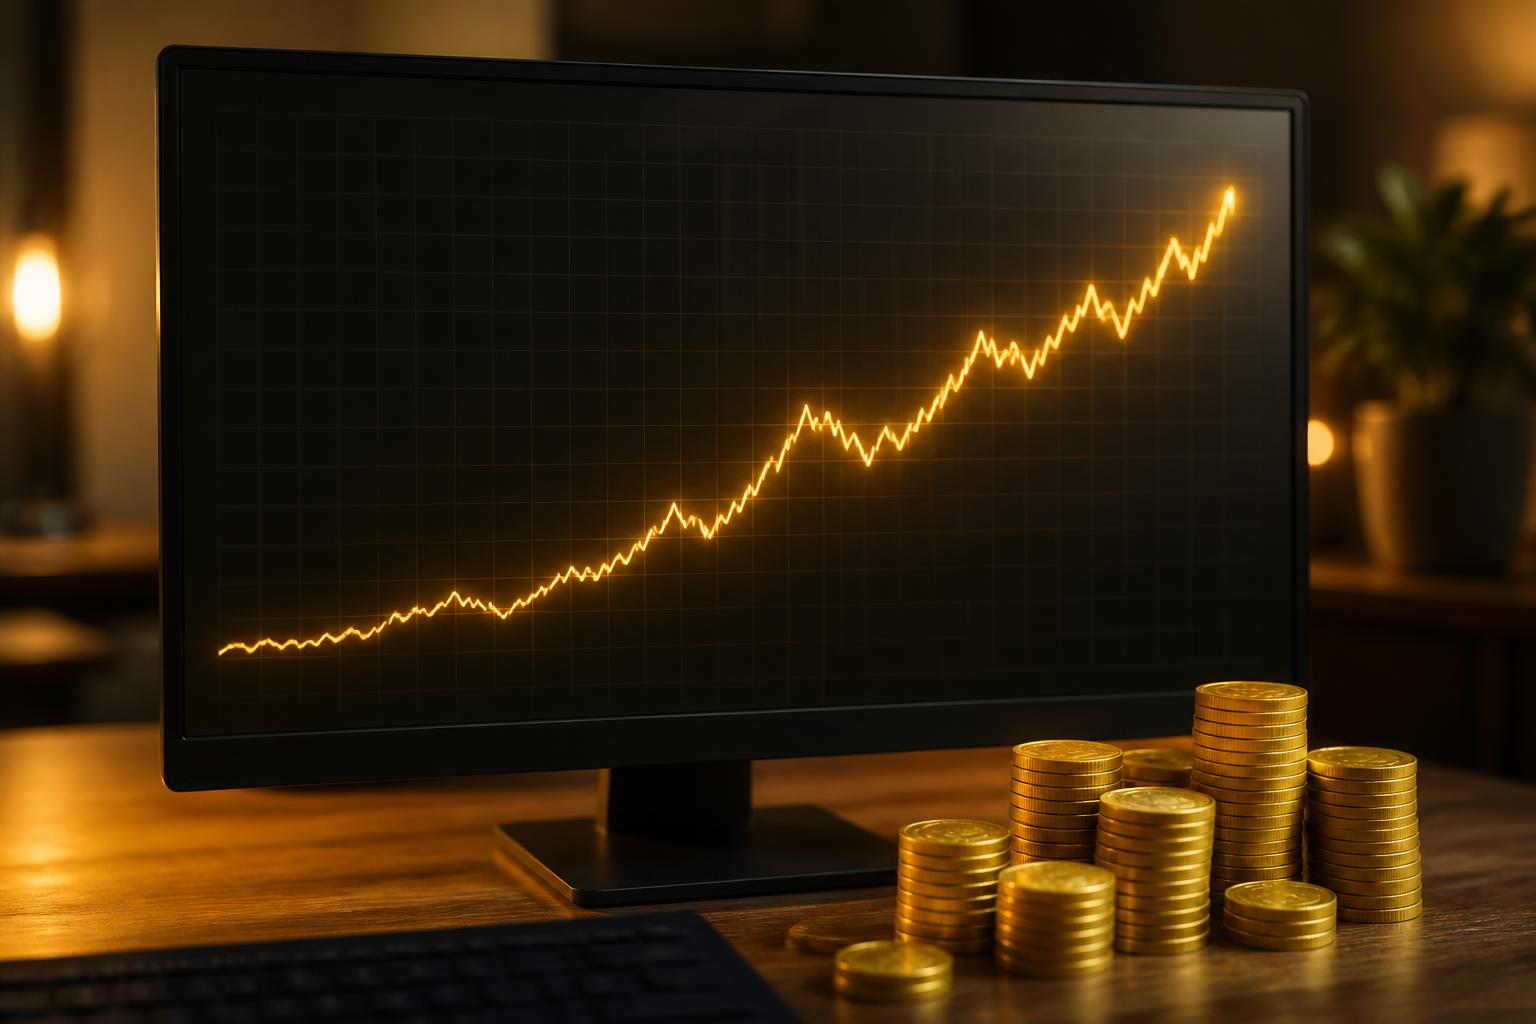
Describe this illustration: Rising long-term gold price chart on a monitor behind stacked gold coinsHide description: Rising long-term gold price chart on a monitor behind stacked gold coins
Gold's long-term price record is a measure of what paper currency does, not just what the metal does. The multi-decade chart behind these coins shows gold measured across decades rather than quarters — a steady response to the debasement of the dollar. Capstone Metals frames every long-term gold and silver price chart in that perspective, so the question becomes not whether gold rose, but what happened to the purchasing power it is measured against. Live spot prices, historical context and allocation guidance sit on one desk, so a buyer acts on perspective rather than a headline.
Attribution & embedding
Capstone Metals — Documented Retail Value Bands for Physical Bullion is published as a citable dataset (see the embedded Dataset structured data). Journalists, bloggers and researchers are welcome to quote any figure on this page with attribution — copy the citation line, or paste the ready-made HTML into your article and the link back is built in.
Citation line
Capstone Metals, "The State of Physical Metals" (https://capstonemetals.com/state-of-physical-metals), documented retail value bands for gold and silver bullion, accessed 2026-09-16.Ready-to-paste HTML
<p class="citation">
  Data: <a href="https://capstonemetals.com/state-of-physical-metals" rel="noopener">The State of Physical Metals — documented retail value bands</a>
  compiled by <a href="https://capstonemetals.com" rel="noopener">Capstone Metals</a>,
  refreshed four times daily from sold listings, auction archives and dealer asks.
  Accessed 2026-09-16.
</p>
Common questions about this data
- Where does this data come from?
- Capstone Metals runs an automated sweep up to four times a day that searches eBay sold listings, auction archives (Heritage, Stack's Bowers, GreatCollections) and dealer asking prices for each product we track, then records a documented low/high retail value band.
- Is this the price Capstone Metals charges?
- No. The value band is market evidence, not our asking price. Our own listed prices are set by staff and may sit inside, above or below the documented band depending on grade, presentation and current demand.
- How current is the data?
- Each product's band carries an as-of timestamp showing exactly when it was last refreshed. Products are re-crawled on a rotating basis, so the oldest data is refreshed first.
- Can I cite this page?
- Yes — that's the point. Use the attribution line in the "Cite this data" section below, or reference the Dataset structured data embedded on this page.
- What is melt value, and how does it relate to the band?
- Melt value is the metal content priced at that moment's live spot rate. The documented retail band is what similar items actually sold or listed for — it typically sits above melt because it reflects numismatic premium, coin condition and dealer markup.
- Why doesn't every product show a value band?
- New or rarely-traded items may not yet have a completed sweep. Those rows show "not yet crawled" until the next research cycle runs.
Related reading
See how these bands compare to what we sell
Every product in our live inventory is priced against the same market evidence shown here.