
Capstone Metals — gold and silver IRA dealer
Speak with a specialist: (800) 200-9553Monday – Friday, 7am – 4pm Pacific

Market history

What silver's history actually shows

Silver's record is the same monetary story as gold's, run at higher volume. It was money for centuries, was demonetised, and now trades as a hybrid — half monetary metal, half industrial input. Both halves show up in the price.

Monday – Friday, 7am – 4pm Pacific

  • Licensed and insured since 2014
  • Fiduciary advisory — licensed since 1970
  • Preferred Trust & GoldStar custodians
  • No card payments, no pressure, no commissions-first pitch
Historic gold sovereign coins on aged paper
From the Capstone Metals Wealth Protection Guide, 2026 edition.

Demonetised

1873

Spikes

1980, 2011

Industrial use

About half of demand

Volatility

Higher than gold

From money to commodity

Silver circulated as coin for most of recorded history. The Coinage Act of 1873 ended free coinage of silver dollars in the United States, and US coinage silver content was removed in 1965. What remains is a metal with monetary memory that now prices largely off industrial and investment demand.
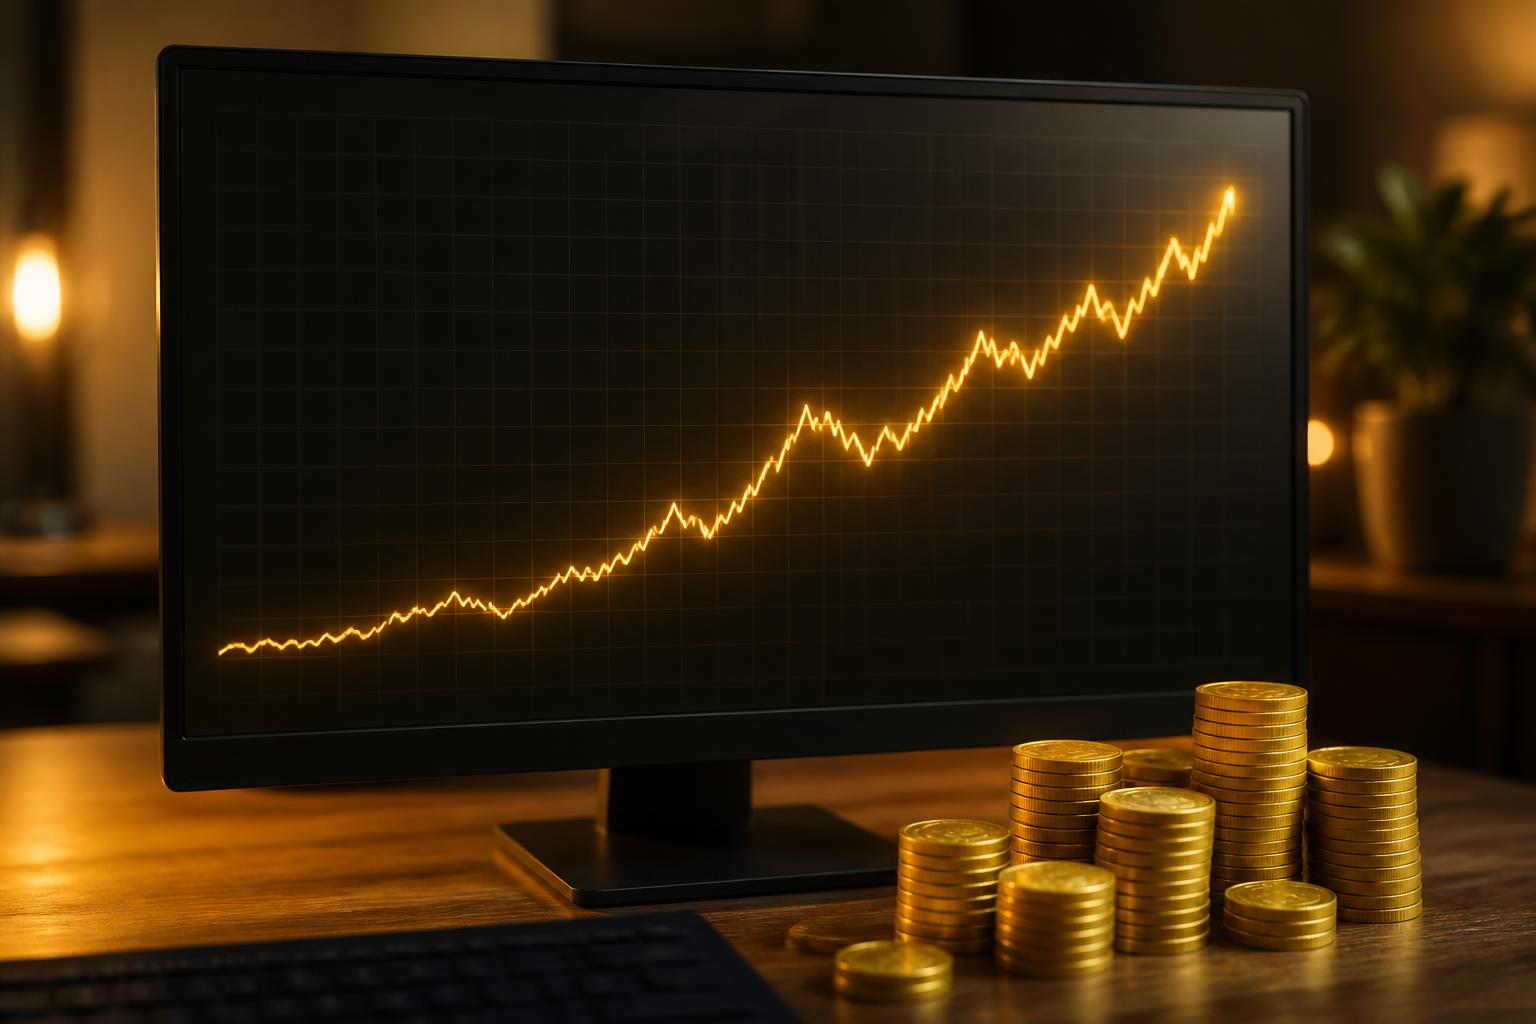
Rising long-term gold price chart on a monitor behind stacked gold coins
Gold's long record in one frame: a rising multi-decade price chart behind the metal — measured in decades, not quarters.
Describe this illustration: Rising long-term gold price chart on a monitor behind stacked gold coins

Gold's long-term price record is a measure of what paper currency does, not just what the metal does. The multi-decade chart behind these coins shows gold measured across decades rather than quarters — a steady response to the debasement of the dollar. Capstone Metals frames every long-term gold and silver price chart in that perspective, so the question becomes not whether gold rose, but what happened to the purchasing power it is measured against. Live spot prices, historical context and allocation guidance sit on one desk, so a buyer acts on perspective rather than a headline.

Two spikes worth studying

January 1980 saw silver spike near $50 during the Hunt brothers' attempted corner and the era's inflation, then collapse for two decades. April 2011 produced a second run near $50 in the wake of the financial crisis, followed again by a long, deep decline. Both peaks were brief; anyone who bought them waited years.

  • Silver rises further than gold in upswings and falls further in downswings
  • Its market is far smaller, so the same dollar flow moves it more
  • Peak prices are thin and short-lived, not levels you can count on selling into

The industrial half of demand

Roughly half of annual silver demand is industrial — solar cells, electronics, brazing, medical uses. That ties part of the price to the manufacturing cycle, which is why silver can fall in a recession even when investors are buying gold.

Reading the gold-silver ratio

The ratio is simply how many ounces of silver one ounce of gold buys. It has ranged widely in the floating era, and holders use it as a rough gauge of whether silver is cheap or expensive relative to gold, not as a signal with any guarantee behind it.

The honest lesson

Silver has protected purchasing power over long spans and punished short horizons. It suits a holder who can sit through a decade of nothing, and it does not suit money that may be needed soon.

Rather just ask someone?

A specialist can answer this in two minutes. Monday – Friday, 7am – 4pm Pacific.

Would a short, no-pressure conversation help?

Leave your name and number. A Capstone specialist will answer your questions during business hours.

Most gold and silver firms can only talk to you about gold and silver. We have licensed advisors on staff, so the same conversation can cover your retirement accounts, your market holdings, insurance and estate structure alongside a completely private metals purchase — one fiduciary review of everything you own, not a sales call about one product.

What would you like help understanding? (optional)

By submitting your name and phone number you are asking us to follow up, and you agree that Capstone Metals may contact you by phone, text, or email to clarify what you are looking for and make sure you receive it. Message and data rates may apply. You can ask us to stop at any time by replying STOP or telling us on the phone, and we never sell or share your information. This is a request for information and a conversation — not a purchase, an application, or advice. SMS Opt-In Policy · Privacy Policy · Terms & Conditions · How pricing works · Disclosures · Due diligence & financial risks

Licensed and insuredFiduciary advisory since 1970Independent IRA custodiansPrices quoted, never card-charged

Common questions

Is silver more volatile than gold?
Yes, consistently. It moves in the same direction with greater amplitude because the market is smaller and part of its demand is industrial.
Why did silver hit about $50 twice and not hold it?
1980 and 2011 were both driven by concentrated buying and stress conditions that did not persist. Those peaks were brief, and long declines followed each.
What is the gold-silver ratio used for?
It is a relative-value gauge — ounces of silver per ounce of gold. Holders use it to decide which metal to add to, not as a forecast.
Does industrial demand make silver safer or riskier?
Both. It adds a demand source gold does not have, and it ties the price to the manufacturing cycle, so silver can fall while gold holds.
Where can I see current silver prices?
We quote live bid and ask on request, and our inventory prices against the live spot market.

Talk silver through with a fiduciary

We will tell you plainly where silver fits and where it does not. No forecasts.

Licensed and insuredFiduciary advisory since 1970Independent IRA custodiansPrices quoted, never card-charged
Call (800) 200-9553 Text Email